We obtain a vector with 100 equidistant points from 0 to 2*pi with the linspace command:
x = linspace(0,2*pi,100); % note semicolon to hide output
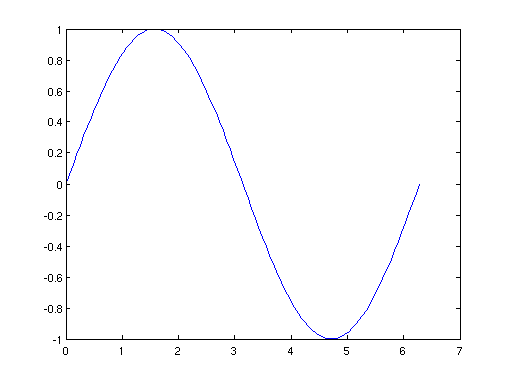
Here is the sine function in the interval [0,2*pi]
plot(x,sin(x))
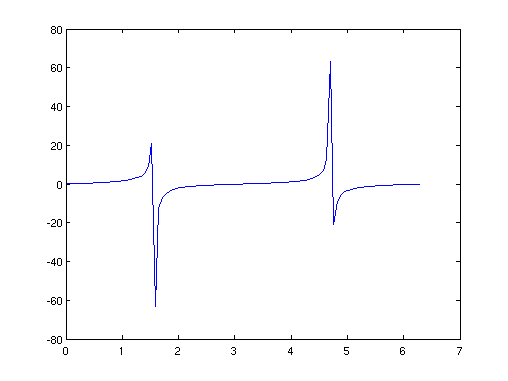
Here is the tangent function in the interval [0,2*pi]. First we show the whole plot, then we only show the y-axis between -5 and 5. Note that the vertical lines are not really part of the function.
plot(x,tan(x))
figure        % needed to show second plot in same cell
plot(x,tan(x))
axis([0,2*pi,-5,5])
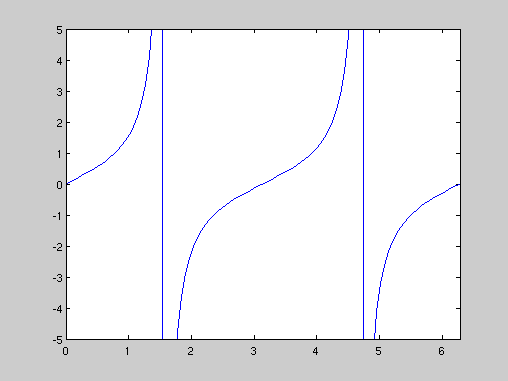
Note that Matlab chooses the y-range automatically, and also removes the vertical lines.
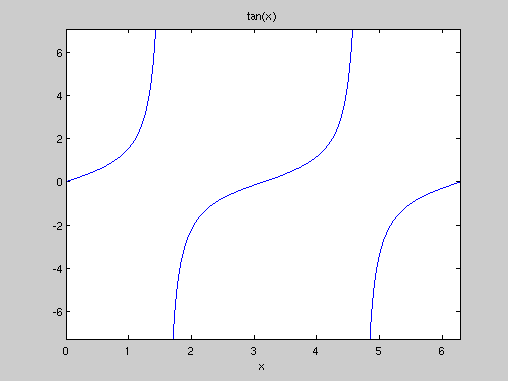
ezplot('tan(x)',[0,2*pi])