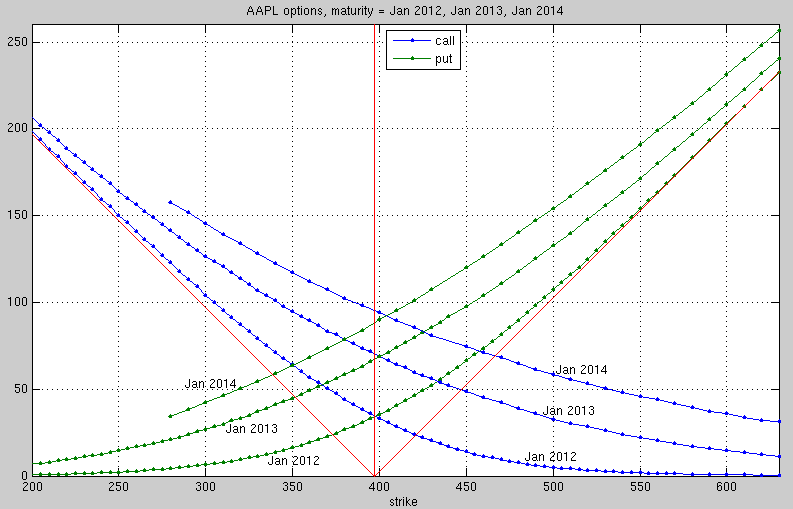
The price of an option depends on the strike price. Below we plot the option prices on Sept. 28, 2011 (vertical axis) for different strike prices K=200 to 600 (horizontal axis).
Put options prices are
plotted in green. Here the payoff is H(S) = (K-S)+.
Note that the payoff for a higher strike is ≥ the payoff for a lower strike, e.g.,
(400-S)+ ≥ (300 - S)+.
Hence the put option price increases with increasing strike K.
We show option prices for three different maturities: Jan 2012, Jan 2013, Jan 2014.
If the maturity is very soon, then the price for a call option is close to the current
payoff (S0 - K)+
as a function of K. This function is shown above as the left diagonal red line
for K ≤ S0, continued by the horizontal axis for K > S0.
If the maturity is very soon, then the price for a put option is close to the current
payoff (K - S0)+
as a function of K. This function is shown above as horizontal axis for K < S0,
continued by the right diagonal red line
for K ≥ S0.
If maturity is at a later time, the option prices are farther away from the current payoff.
Theoretically the curves for later maturities should be shifted because of the interest rate. But in 2011 the interest rates were very close to zero (and still are right now). Therefore the option price curves approach the red diagonal lines (without any shift).
The goal of this course is to understand these option prices in more detail, and to find an approximate formula for the option prices.